Chapter 2 Before We Start
Before we start in earnest, let’s talk about data science workflows. Also, we’ll learn a bit about the data we’ll be working with throughout the lessons.
2.1 Data Science Workflows
The lessons are intended to step through some of the initial and necessary steps of most data science worfklows:
Loading data, examining and cleaning data, and manipulating data – renaming and recoding variables, deriving new variables, arranging data, joining data sets, and reshaping data (Chapter 4 - Data Preparation);
Visualizing and exploring data graphically, looking for unusual observations, variable distributions, unexpected patterns, or anticipated relationships (Chapter 5 - Data Visualization);
Building models with data starting with the linear regression model, one of the most commonly-used statistical models, including estimating, interpreting, and evaluation model results (Chapter 6 - Models for Inference).
Of course, first we have to learn about R and RStudio (Chapter 3 - Introduction to R and RStudio)!
Steps 1-3 constitute fundamental processes for answering questions with data. While we’ll address them in this sequence, data science workflows are much more iterative and entangled – we load data and look at it, do some visualization, some recoding and more visualization, some cleaning in response to what we see, more visualization, some modeling, and more visualization (for example).
Garret Grolemund and Hadley Wickham, in R for Data Science, represent it like this:
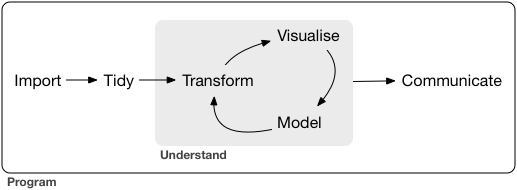
Throughout, the emphasis is on learning by doing. The material will provide examples and explanations, but often it will make more sense when you try to replicate and extend the examples or use the same techniques to answer a different question.
Finally, we’ll emphasize reproduciility – making your work easy to reproduce for your future self or others – through clear and well-commented scripts that can be “read” to understand and recreate your steps. In fact, all of the code to generate these lessons are available in the GitHub repository for this project – go crazy!
2.2 The Data
Throughout the lessons we’ll use data from the US Department of Education’s College Scorecard to inspire and illustrate the tools, procedures and methods.
Some key points to develop:
Because this project started as a pilot for an open course platform for high school or college instructors in Virginia, I wanted data that the most likely learners could relate to quickly and that could be used to address a wide variety of questions.
The data is fairly complex with data on 7100+ institutions for 21 years (and 1900 fields). It’s often used to examine college completion, debt load, and a range of other outcomes. ADD MORE
It is not, however, without limitations, mostly around transfer students. ADD MORE.
2.3 Setting Up (Optional)
Within the Virginia Open Data and Technology Platform, you’ll have access to R and Rstudio and the packages we’ll use. You should be fine.
If you’re working on your own computer, or if you want to be ready to work on your own computer when you’ve completed these lessons, you’ll need to install R and RStudio on your computer (we’ll talk about what these are in the next lesson). Both are freely avialable online.
- First, install R. Download R from the Comprehensive R Archive Network (CRAN), selecting the link that corresponds to your computer’s operating system (Linux, Mac OS X, Windows), and installing the package once it’s downloaded.
- Then, install RStudio. Go to RStudio’s download page and click Download under RStudio Desktop. Under “Installers for Supported Platforms” select the appropriate installer for your operating system. Once it’s downloaded, click the downloaded installer.